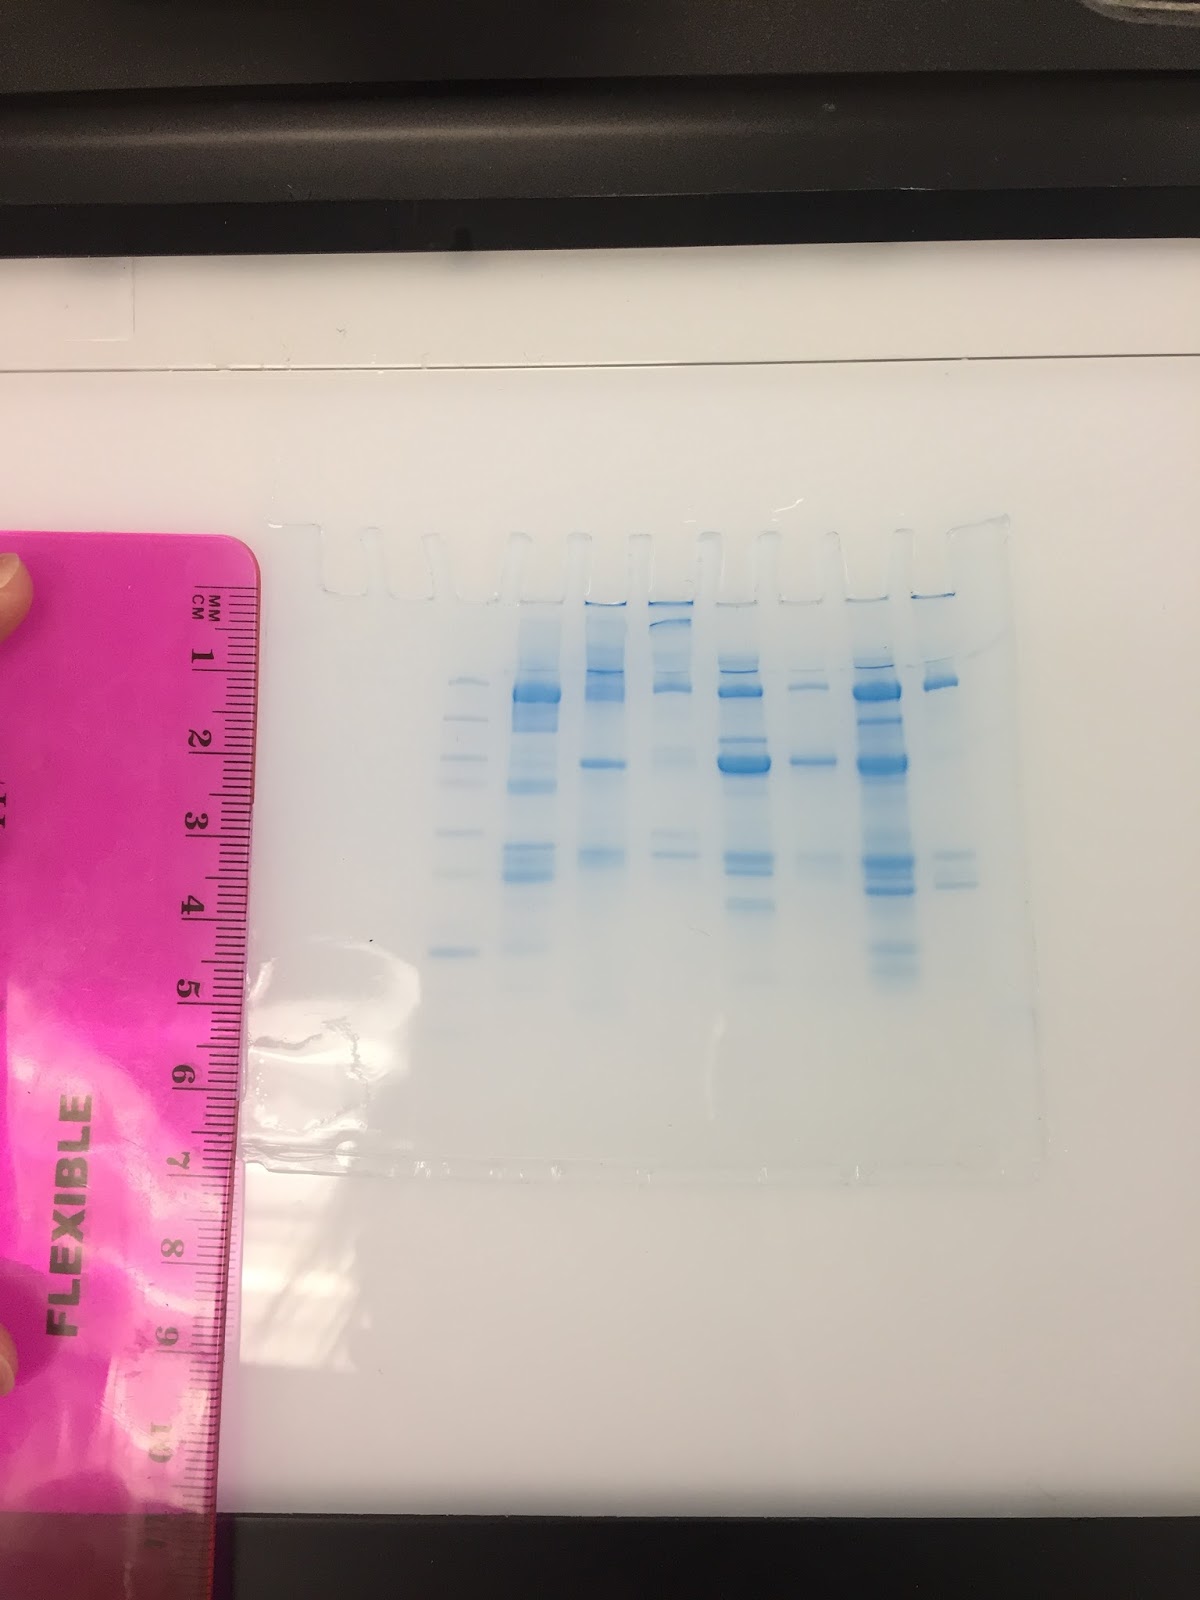
For our project, we ran gels comparing breast, leg and heart tissue from both chicken and turkey. Our results so far have been satisfactory and followed our hypothesis. We have looked at the results of both our gels, and seen a pattern of skeletal muscle being mostly similar while cardiac muscle seemed to have different bands that both breast and leg for both chicken and turkey.
We found that our second trial of running the gel seemed very faded, most likely due to us not letting the muscle sample incubate at room temperature for a long enough period of time. This means our data from the first trial is more accurate. In our error analysis we will mention this issue in detail and what we were supposed to do.
Showing posts with label Research-Project-Blog#2-(individual)-Jenny. Show all posts
Showing posts with label Research-Project-Blog#2-(individual)-Jenny. Show all posts
Friday, February 24, 2017

Individual Blog Post #2
So far, the hardest challenge of our research project has been running a gel with clear results. On our first trial, we didn't measure or weigh our samples and chose portions of our organisms that weren't completely muscular in nature. The results were blotchy bands. Our second trial went better, as we chose samples of similar weight and checked that each sample came from adductor muscle or adapted muscle, such as a tentacle (in the case of squid). I would advise other groups to use a very small sample size (~0.04 g) to avoid smeared bands.
Unfortunately, the second gel tore when we removed it from the screen. We quickly ran another gel, using leftover supernatant from our original samples. Although the microtubes had sat out for nearly two hours, we hoped the proteins were intact enough to give us clear results. Indeed, even though some bands appeared slightly bloated, the overall pattern was clear enough to compare species to each other. Our problems with sample size and choice, as well as the hasty preparation of the third gel electrophoresis, will definitely be discussed thoroughly in our error report.
Unfortunately, the second gel tore when we removed it from the screen. We quickly ran another gel, using leftover supernatant from our original samples. Although the microtubes had sat out for nearly two hours, we hoped the proteins were intact enough to give us clear results. Indeed, even though some bands appeared slightly bloated, the overall pattern was clear enough to compare species to each other. Our problems with sample size and choice, as well as the hasty preparation of the third gel electrophoresis, will definitely be discussed thoroughly in our error report.
 |
| Although some bands are bloated, this is the best gel out of three for our group! |
Individual Blog #2
Our mussel sample already died, not much of the mussel was left inside of the shells.
We tried to use the proper part of mussel, but it still did not show the bands as well as the other samples. The first time we ran the gel, too much of the sample was used, and even incorrect muscles for some of our samples. This meant we had to run it one more time. During the second run of the gel electrophoresis, our gel broke into 2 pieces. We re-used the samples that had been sitting outside for more than 30 minutes while the first gel was running.
We predicted the outgroup, shrimp would have a different pattern of bands compared to the other samples. In other words, the shrimp sample should not share bands with any of the other five samples. However, It is hard to say that shrimp is the outgroup from the results of running our gel electrophoresis. We also predicted that only the phylum mollusca would share certain adhesive proteins, with the size being about 500 kDa. We cannot state with full confidence that all the samples except shrimp have similar band size; it seems that the shrimp sample is far too similar. To find a sufficient way to support our hypothesis that shrimp is the outgroup from 6 samples because shrimp belongs in a different phylum, we can state that arthropod, and squid will be the outgroup from phylum molusca(remain 5 samples).
Aaron Oberstadt
The majority of our group's problems match those of others in the class. We decided to repeat the fish protein lab with various mollusks. This proved to be difficult to exactly replicate in our second gel as the mussel samples had all died. Like Asmah mentioned, we had significant bubble production when transferring Laemelli buffer. Any major issues with bubbles or liquid that would not settle to the bottom of a tube, we found, could be solved with a centrifuge. Finally, on our second gel, a large number of our protein bands were extremely faint, which made reading it very difficult.
These issues, among others, will be addressed in our error analysis. Lacking a second sample of mussel is potentially a major cause of error in our final results, and we could not have prepared for that. We did not maintain consistency in who transferred the protein samples from their respective tubes to the polyacrylamide gel, which could be a source of error. The second gel ran for 5 minutes longer than the first gel, potentially explaining the faintness of its protein bands. Finally, our inability to measure bands that should exist but are too faint to accurately see can also contribute to error in our results.
The majority of our group's problems match those of others in the class. We decided to repeat the fish protein lab with various mollusks. This proved to be difficult to exactly replicate in our second gel as the mussel samples had all died. Like Asmah mentioned, we had significant bubble production when transferring Laemelli buffer. Any major issues with bubbles or liquid that would not settle to the bottom of a tube, we found, could be solved with a centrifuge. Finally, on our second gel, a large number of our protein bands were extremely faint, which made reading it very difficult.
These issues, among others, will be addressed in our error analysis. Lacking a second sample of mussel is potentially a major cause of error in our final results, and we could not have prepared for that. We did not maintain consistency in who transferred the protein samples from their respective tubes to the polyacrylamide gel, which could be a source of error. The second gel ran for 5 minutes longer than the first gel, potentially explaining the faintness of its protein bands. Finally, our inability to measure bands that should exist but are too faint to accurately see can also contribute to error in our results.
Research Project Blog #2
My group's goal is to see how well the muscle proteins within bear, caribou, deer, elk, moose, and chicken legs differentiate from one another. Our hypothesis is that, while the proteins of all four species of the deer family will be fairly similar to each other, deer and elk will be most closely related to each other, and caribou and moose will be the closest related to each other as well. However, we found the surprising result of bears having very similar proteins in their muscle tissues as the other mammals! I suppose it's not TOO surprising, since bears are also mammals but the results are actually very identical. (see below) As a matter of fact, all the sampled animals have relatively similar proteins in their muscles, with chicken being the one who holds the most difference.
Lane components:
Lane components:
- Empty
- Kaleidoscope standard
- Elk
- Moose
- Bear
- Chicken leg
- Caribou
- Deer
- Actin & Myosin standard
- Empty
 |
| Figure 1. Result of the first gel electrophoresis. |
 |
| Figure 2. Result of the second gel electrophoresis. |
Due to this, we're faced with greater challenge of distinguishing the differences between each muscle tissue. The bands on the second gel are also smeared in many places, most likely due to too much muscle tissue in the sample or poor pipetting technique, making it even more difficult to read the results. There could also be contaminants on the razors that would interfere with our data, all of which will be discussed in the error analysis section of our project. I'd like to advise other groups to choose a variety of species for more interesting results, and to avoid cutting too much of the muscle tissues when preparing your samples for gel electrophoresis. Less is more!
Research Project Blog #2
Name: YU CHIEH LIN
In both labs, we did shrimp, mussel, scallop, octopus and clam for the muscle protein research project so did Marisa’s group, we found out that it was clever of them to use the method of taking the average of measurements from each member. This can increase the accuracy of the comparison of protein weight from species. The results of the gel in the first lab turned out pretty clear, it’s easy to see each band was completely separated, which helped us to estimate each band’s migrated distances. However, the challenges that our group encounter was in the second lab, the gel were pretty stained and blurry to see where bands stood at. We assume that the error of this was from the very first step in the procedure, which was cutting the muscles from the given samples. We took Gwen’s advise to measure the weight of the each samples that we cut off, because the size of the muscles we cut off affects the clearness of band shown in the gel. According to Dene’s record of the weight of the each samples in the second lab, the clam was 0.1 grams more than the average weight, and the mussel was 0.1 grams lesser than the average weight. From the lane of mussel and lane of clam, we knew that the more sample we insert to get the proteins, the more fainted bands we will get in the gel. However, we cannot compared this error analysis with the the first lab, since we only recorded the weight of samples in the second lab. In addition, in the second lab, there were no live mussel for us to use as we did in the first lab. So, we used the dead mussel from the material counter, and we cut off the foot muscle instead of the missing adductor muscle. We suppose the results of mussel among the first lab and the second lab will be slightly different by showing a variety of proteins since we were using adductor muscle of mussel in the first lab.
Question: What is the factor do you think that differ the result of dead mussel and live mussel?
Research Project Individual Blog Post #2
Individual Blog Post #2
Asmah Tadmori
The challenge that encountered our group is the presence of some
smearing in our bands that makes it harder for us to detect which is a true
band and which is not. Smearing problem can't help us identify the
relationships between our mammals and chicken easily in our phylogenetic tree.
Another challenge was while pipetting the buffer using a plastic pipette. We
couldn't know if we loaded the appropriate amount of buffer due to the presence
of bubbles during each time of pipetting. My question for other people is that,
Do you guys experience any bubbles while you were pipetting buffer? And Did you
have a smeared bands that made it difficult for you to identify the
similarities between the mammals?
For my error analysis, I would assume that
contamination has occurred especially while we are using the edged razor blade
because we might hold it different ways, and our hands may hold some bacteria.
Specifically while cutting the meats, the meat piece start touching most sides
of the cup, sometimes the edges which the place where hands touch it.
Furthermore, we didn't heat the Actin & Myosin standard at the first gel
running, whereas, in the second gel running, we heated it because we didn't
know if we had to heat it or not. Consequently, I will discuss the contamination
of our skeletal muscle samples, and heating Actin and Ayosin standard sample
consequences. Additionally to the movement of our gel that might lead one of
the samples in the gel to spill out and cause smearing.
Research-Project-Blog#2-(individual)-Jenny,
Our group’s experiment was conducted in a similar fashion as the Fish Muscle Protein Lab. The primary difference was in the use land animals typically consumed by humans. A challenge we encountered was not having a solid hypothesis established prior to the experiment. Our hypothesis was formulated in the form of a reconstructed phylogenetic tree based on morphological and physiological traits. Besides affirming the correctness of the reconstructed tree, it is unclear what the actual purpose and driving question of the experiment was.
Within our data, a major place of error lies within a bend in the gel. During transport of the container to the viewing area, the gel was warped slightly. The protein bands do not align in true vertical. This skews the data of the lanes within the bottom of the image. We will be including that data taken from those lanes may not be reliable.
Research Project Individual Blog Post #2
In the first gel electrophoresis we ran, two of the samples
were slightly denatured, this could have been due to fat content of the
proteins we chose or could have been from exposing the samples to too much heat
in the water bath. The proteins affected were cougar and cow; the most likely
cause of error was probably due to fat content. When we ran the gel a second
time, the results fared better, and we followed the same procedure, regarding
water bath time, leading to the conclusion heat played little part in the error
of the first run.
One observation surprised my group in the first run of the
gel, we could use the larger pipette tips for pipetting the samples into the
well, we only did this a couple times, but it did not negatively impact our
results; we just had to ensure the tip was centered with the well. The second
run of the gel we used the thinner micropipette tips to transfer the samples to
the well. We also transferred fewer microliters to well in the second run in
hopes of avoiding the denaturing we experienced in the first run. We noted
little difference between the first and second run in our gels. The gels provided
some evidence we could not predict beforehand the bear, cow, and sheep share a
protein band in common toward the bottom of the gel. We expected the bear would
reside in the middle in terms of phylogeny as it is still mammalian and omnivorous,
this commonality in protein suggests some relation.
Research Project Individual Blog Post #2
As we approached our gel results for looking at skeletal muscles samples from 6 different organisms which are deer, elk, Moose, Caribou, bear, and finally chicken. We were faced with the challenge that 5 of our samples (deer, elk, moose, caribou, and bear) shared many bands. We believe that was due to the fact that they are all mammals. In addition, the deer, moose, elk, and caribou share many phenotypes and look very similar then they must be closer together on a phylogenetic tree. Nonetheless, it was easy to distinguish the chicken skeletal muscle sample as the outgroup since it only shared one band with all of the other samples. However, for the other 5 samples, we see lots of similarities and very few differences which will be a problem in determining each organism place on the phylogenetic tree. My question for other groups is did you measure all the bands in every lane or did you choose certain bands to measure in your gels?
Another challenge we had which could also cause us some error is that we had a lot of smearing in our gels. We couldn’t tell if there is one big band or 2 bands in a certain lane as a result of the smearing. The smearing was caused by having too much protein present. I believe what caused this is the chunks of skeletal muscles we used at the beginning of the experiment were too big. This led to having a big amount of proteins extracted and when running the gel caused smearing. Another source of error can be as a result of having a really faint band that we could believe it is a band while it may not be. I tried to count how many bands each lane has and each time I did it, I ended up having a different number of bands in each lane. The appearance of faint bands is the outcome of not having enough amount of a certain protein in a skeletal muscle sample. Furthermore, seeing very faint bands could be also the result of a problem in staining the gel. Perhaps there is some contamination in the dye we used and it didn’t stain the gel very well. Moreover, the loading of samples in the gel could be a source of error too because the gel is very thin and could be punctured easily. Nonetheless, it could be that we loaded too much of one sample, the existence of bubbles in a well, and even that we loaded the sample above the gel well given that wells are small and mistakes can happen.
Individual Blog Assignment #2
One of the big challenges my group encounter would be the pipetting process, because the protein samples have to be loaded in an angled form. Our group also encountered a problem with the protein bands in the first gel: they were really big and smeared. For this reason, we ran another gel and found a greater issue when we cracked open the cassette gel plate. The top part of the gel was missing. Not long after, we came to realize that due to an aggressive rinse of the gel plate through DI water, the gel was pierced and drained down into the sink. This gave us an opportunity to run a third gel and the results were satisfying.
In the error analysis section of the discussion, I would like to discuss the extraction of the proteins. The size of each sample can really affect the results of the gel. Based on the first gel our group ran, the samples were too diverse in size, causing some protein bands to be thick and smeared. In the second and third gel we measured our sample to be around the same range of weight and the gel results were much more improved. Errors can in turn be beneficial because running multiple gels helps us get better data to compare/contrast and produce more accurate results.
Group Research Project Updates
Our group research project has been going well, and we've been trying to work on it every day. All of our data has been collected, and all we need to do is put our findings into words. There have been a few challenges, one of them being our protein gel electrophoresis bands. Regardless of running two trials, our gel electrophoresis bands have come out smeared, making it difficult to determine which markings are bands, and which ones aren't. I have a feeling that for both trials, the muscle sample we cut for each organism was too big, resulting in smeared bands. We'll definitely be addressing this in our error analysis section, as determining our bands has proven difficult, and we could be assuming certain markings are bands when really, they aren't.
Research Project Blog Assignment #2
While running the samples of mollusc through electrophoresis, our group experienced an issue that delayed our progress. After running the electrophoresis for 30 minutes, we noticed that the gel was nearly torn in half, which forced us to quickly reload the samples for a third time and run it once more. We were fortunate enough to keep the samples with us, which made it possible to run the them again. Another problem in the beginning of the experiment was the mussel and clam were very near each other when we were trying to open them up. It was possible that the two molluscs became contaminated with one another’s proteins, which would affect the results of our gel run.
Our group initially hypothesized that the shrimp would be characterized as the outgroup in our phylogenetic tree, but the results of the bands sort of disagreed with this. When we observed the bands, we noticed that the shrimp actually had very similar bands to the fourth row from the right: scallops. The shrimp was expected to have bands that were drastically different than to any mollusc, but this was not the case. Also, our 5 molluscs were not as similar in terms of bands with each other as expected. The data we found can help us produce a corrected hypothesis that agrees with the comparisons found with the bands.
Thursday, February 23, 2017
Research Project Blog#2 (individual)
Some challenges or surprises that we encountered was in
our hypothesis of what we thought would happen during our testing. We thought
that there would be a difference in the proteins from a leg meat (dark slow
twitch muscle) to a breast meat (white fast twitch muscle) from a turkey and a
chicken then the duck has both dark meat in the leg and Brest. When we ran the
gel electrophoresis we discovered there is no difference in the protein in the different
muscles. That kind of confused and surprised us so we ran the second gel and
sure enough the same thing happened. Then we sat down and thought about it some
more and we realized that we missed a key fact to why the muscles are different
between the fast and slow twitch, it’s because the darker meat has more
myoglobin which stores oxygen for are needed for long use of activity in the
muscle. This was not what we originally thought we thought that the proteins
that make up the muscle must be different but it’s just the build op of
myoglobin in the muscles that give them there fast and slow twitch
characteristics.
In our error analysis section of our discussion we could
discuss how we messed up putting our sample 6 into well 8 and it flowed over
into well 9 and kind of messed up our gel a little. But we were still able to
get conformation from running the gel and roughly matched our first gel we ran which
was a lot cleaner looking and precise. In
addition, our second gel just seemed to not have ran right for some reason. I am
not sure exactly weather we had some sort of additional contamination or
crossing of our proteins but the bands seemed large and very bright and had
some in places we weren’t expecting to see.
Research Blog Post Individual #2
After my group run the gel for
couples of times, we notice that the bands for each lane are somehow very
similar, I would say they look the same. I belief that this is due to some
errors that we have made during the gel electrolysis process which makes it
hard to identify the properties of each organism. However, I still don’t know
what exactly this error is. In addition, even we run the gel for the second
time, we still gather the same result. From this result, make us to come back
and look at our hypothesis again since this data can’t be used to proof our
prediction.
Subscribe to:
Posts (Atom)