Evolution Lab 1: Using Beads as a Model for Allelic Frequency Changes in Genetic Drift.
Team Name: The Beaddazzlers
Team Members: Marisa Kemper, Michelle Le, Zach Bigelow, Eloina Rodriguez
Our team was given beads to use as a model for alleles. Each bead color represented an allele for that color. Our hypothesis was that as time went on, and generation after generation of beads came and went, bead color (allelic frequency) would not change significantly. In other words, our prediction was that after ten generations of random bead "mating", generation 10 should look the same as generation 1 in terms of bead count. If generation 10 was significantly different, we knew we had either natural selection or genetic drift occurring. In order to decide between which, we would have to look at the way in which generation 10 differed from generation 1. And so we went on our merry way, pulling beads out of cups to decide which "alleles" stuck around and made it to the next round, and which were gone forever, making sure to record each pool of beads for each generation. Our group of four scientists were split into pairs, with Michelle and Zach being "Population A" and Michelle and Marisa being "Population B". Our resulting alleles per generation are graphed for each pair below (Figure 1 and Figure 2):
| Figure 1. Change in frequency of four different colors of beads in Population A over a span of ten generations as a representation of change in frequency of alleles within a population over time. Population A consisted of fifty beads randomly selected from an original pool of 100 beads. |
| Figure 2. Change in frequency of four different colors of beads in population B over a span of ten generations as a representation of change in frequency of alleles within a population over time. Population B consisted of fifty beads randomly selected from the same original pool of 100 beads that population A was selected. |
After putting this data into graphs, we began to form some opinions. Perhaps we had genetic drift, because the allele change seemed to be random, and while some bead colors appeared to be selected for in Population A (like clear and white), others were selected for in Population B (red dominated the numbers). However, to be sure we did a chi-squared analysis for each population. The calculations and results for this are tabulated below (Table 1 and Table 2):
Chi-squared for Population A
Allele (Bead)
|
e
|
o
|
o-e
|
(o-e)²
|
(o-e)²
e
|
Red
|
8
|
6
|
-2
|
4
|
0.5
|
Clear
|
15
|
16
|
1
|
1
|
0.07
|
Blue
|
10
|
12
|
2
|
4
|
0.4
|
White
|
17
|
16
|
-1
|
1
|
0.06
|
10.03 = chi-square
|
Table 1. Chi-square calculations comparing the frequency of alleles in generation 10 to generation 1 of Population A to determine if it supports a change in allele frequency over time.
Chi-squared for Population B
Allele (Bead)
|
e
|
o
|
o-e
|
(o-e)²
|
(o-e)²
e
|
Red
|
17
|
16
|
-1
|
1
|
.06
|
Clear
|
10
|
7
|
-3
|
9
|
0.9
|
Blue
|
15
|
11
|
-4
|
16
|
1.07
|
White
|
8
|
16
|
8
|
64
|
8
|
1.03 = chi-square
|
Table 2. Chi-square calculations comparing the frequency of alleles in generation 10 to generation 1 of Population B to determine if it supports a hypothesis of change in allele frequency over time.
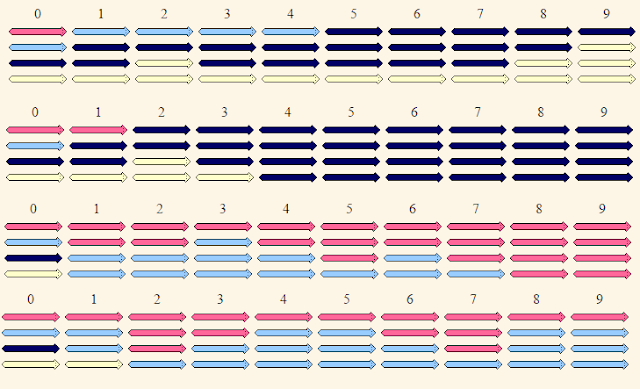
So what are our final thoughts? The data between Populations A and B are wildly different, but this difference helps us draw a conclusion. For population A, with 3 degrees of freedom, a p-value of 0.05, and a critical value of 7.82, the results suggest we reject our null hypothesis because our calculated value of 10.03 is greater than 7.82. For population B, also with 3 degrees of freedom, a p-value of 0.05, and critical value of 7.82, the results suggest we do not reject our null hypothesis since our calculated value of 1.03 is less than 7.82. The results in generation 10 appear to be the way they are merely by chance, otherwise Population A and B would agree more in graph shape and in chi-squared interpretation. Because the beads were identical to each other except in color, and because color was masked by the cup (the involved researchers were blind to the color they were picking), this change in bead color was completely random and based on the chance that some beads were randomly grabbed more than others. In fact, if we had selected generation 3 or generation 5 in population A as our final observed generation, we would have stated there was no change in those alleles and supported our hypothesis! To further illustrate this point, here are some images from the drift-worm simulation found on The Biology Project's website that works in the same way our bead experiment did:
 |
| Figure 3. Four different runs of the driftworm simulation. Courtesy http://www.biology.arizona.edu/evolution/act/drift/about.html |
Notice that these worms are four different colors, like our beads, and go through 10 generations as well. What do we see? We see that every generation 10 was different, as if created by throwing the dice. This is exactly what we experienced with this experiment. So while we are unable to definitively support or reject our hypothesis (it depends on whether you go with Population A or B) we can at least say that our model followed the process of genetic drift, variation in a population that is due to the random chance of some alleles not being passed on.
No comments:
Post a Comment